Swell Buoy
The Wave Height readings are taken from a buoy situated approximately 1km from the heads towards Portsea. The swell readings are a very accurate range of what you can expect on the open beaches such as Portsea, Gunnamatta and Woolamai. It should be your first site to check before heading off, especially when it is still dark.
At a minimum you want to check the HS Swell which is the average height of the highest one-third of all waves.
| HS SWELL | Where to Surf |
| 0.75m to 1.2m | Gunnamatta to Portsea |
| 1.3m to 2.0m | Flinders |
| 2.0m + | Point Leo |
Let's look closer at the Wave Height graph as it can be a bit confusing on your first visit.
Wave Height
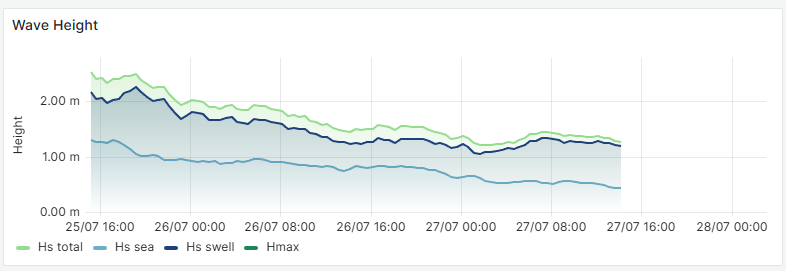
- Reading the graph can indicate a possible rise or fall in the swell. Its recording of wave heights and frequency is updated every 30minutes.
- HS Swell the average height of the highest one-third of all waves.
- HS Sea is the chop created by any wind
- HS Total is a combination of the swell and wind chop
- Hmax is the largest wave recorded at the time of reporting. It’s an important measurement as this will be the biggest set waves coming through. On the open beaches with a HS Swell of 1.5m you might have to deal with 2m+ set waves
The Swell Period is another indicator of the size and quality of the waves. The longer the period, say 12 to 14 seconds indicates a ground swell. That means you will be seeing a 12 to 14 second gap between set waves.
If you see a reading around of 7 to 8 seconds then you are looking at mostly wind generated waves (not swell), and it's probably a strong Westerly onshore blowing.
Current Wind Data
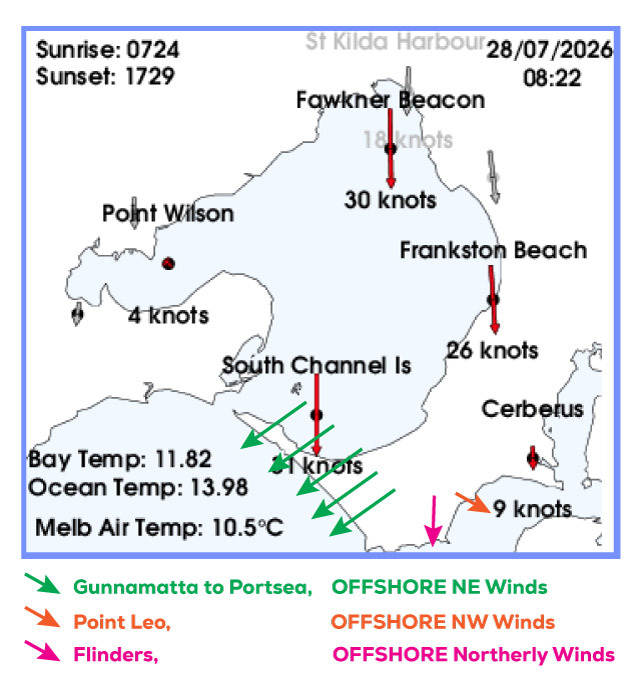
Wind Details are updated every 5 minutes with readings taken at Cerberus (Crib Point), to cover Western Port Bay and Channel Island which lies approximately 5km north of Sorrento, providing ideal information for the Peninsula beach breaks.
The stretch from Gunnamatta to Portsea works best on East to Northerly winds, Flinders a Northerly and Western Port Bay West to Nth West.
Tides
Knowing the tides is critical as Gunnamatta can be almost unrideable with a combination of low tide and 2m+ swell, whereas on the same day at high tide it can probably hold up to 2.5 metres depending on the banks.
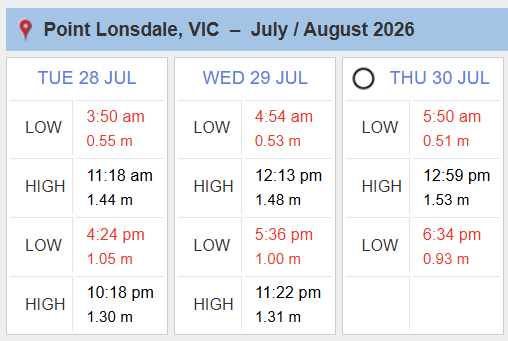
You can see what the tide is going to be by looking at the Point Lonsdale and Western Port tide pages.
The tide rises and falls basically every six hours alternating between a high and low tide. Beginners looking to surf at Point Leo should look to be in the water 2hrs either side of the High Tide for enough water over the reefs with the better conditions being with the incoming tide.
Start to take note of the tide heights too, as too much water on the reef can lead to lower quality waves.
Also notice that tide heights can vary a lot. Some Low Tides can be over 1m, not that much different to a 1.3m High Tide.
Bureau of Meteorology Wave Chart
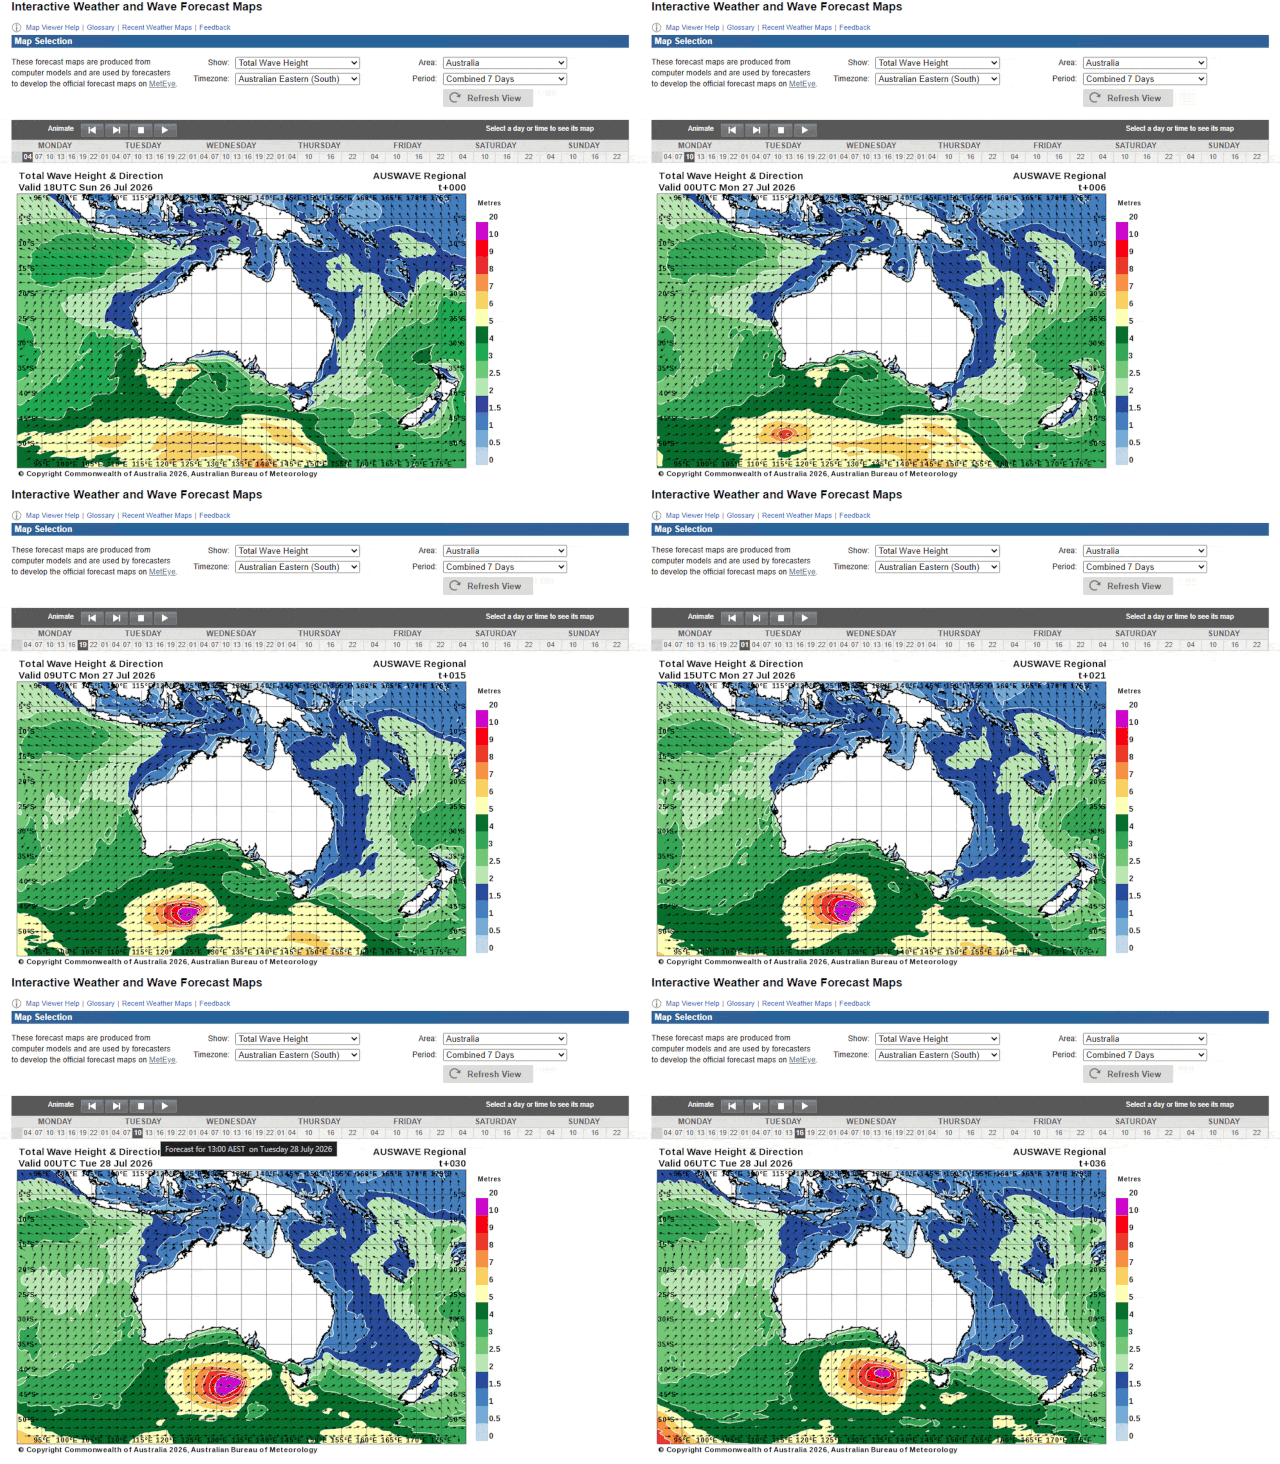
The Wave Height and Direction chart on the BOM website gives a 6 day forecast with a colour graded presentation of the swell. The purple swells are the ones you want if you are looking to surf inside Western Port Bay and specifically Point Leo.
The animation above shows one of those swells on the way to Victoria.
The swell is partially blocked by King Island so never hits our coast in the 10m+ range. However, on occasions it will show in the 4m+ range on the Point Nepean Wave Height Buoy.
Surf Cams
The Trigger Bros website has a range of cameras from Warratah Bay through to Lorne. We have a mix of live video and static 1 minute interval cameras that give you a fantastic snapshot of what the surf looks like at that moment (live) or over the past 20 minutes.
Check the cam pages first then use the links below the image for swell, wind and tides.